
Kassy Raymond, Fellow, Datasphere Initiative
In my last blog post, “Graph Data in the Datasphere: How Graph Databases Can Help Us Understand the Data Connections in the Datasphere”, I discussed the inherent connectedness of data and how graph databases can be useful tools to explore, visualize, and analyze the complex systems surrounding data.
One of the utilities for graph databases is identifying data silos and finding commonalities in data, specifically when data is categorized differently by different sources that are reporting similar concepts. This blog will demonstrate the utility of graph databases for finding commonalities in data using an example from the Global Burden of Animal Diseases.
Data Categories and Siloes in the Datasphere
In the Datasphere, which encompasses all types of data, there are many different standards that can be used to describe and categorize data. Data standards exist as controlled vocabularies, classifications, glossaries, metadata terms, and ontologies and are important to ensure that data can be:
- discovered,
- linked,
- interpreted in the way that was intended,
- aggregated, and
- combined,
ultimately allowing data to be leveraged and used for societal good.
Yet, data standards are sometimes not used, not established, or differ depending on the data source, the country or region of reporting, the sector or discipline, or the time frame in which the data are reported. When classifications of data are ambiguous or differ between and within sources (for instance in siloed data), we face challenges in interoperability, in turn making it difficult to leverage data.
Graph databases are a tool that can be used to analyze the standards and categories used across different data sources to:
- improve the discoverability of data sets that are interrelated, but described differently,
- map standards in the Datasphere,
- analyze the interoperability of data sets, and
- understand how data sets are related based on how they are described
Throughout my Fellowship with the Datasphere, I have been working with the Global Burden of Animal Diseases (GBADs), where we are collecting livestock data from different sources to calculate the economic and health burden of animal diseases on humans and animals. GBADs relies on pre-existing Open livestock data that exists in the Datasphere, and has a need for understanding how livestock data is distributed across the Datasphere.
Data Categories in Animal Population Numbers
Livestock animal population numbers are an important input to biomass calculations, which are used in disease burden and attribution models by GBADs. The main sources of this data are distributed among data sources such as the Food and Agriculture Organization of the United Nations Statistical Database (FAOSTAT), the World Organization for Animal Health (WOAH), Eurostat, and from National Statistics Agencies. In addition, the way that livestock is described and categorized differ by country, year, and between and within sources making it difficult to interoperate between different sources and therefore leverage and use the data.
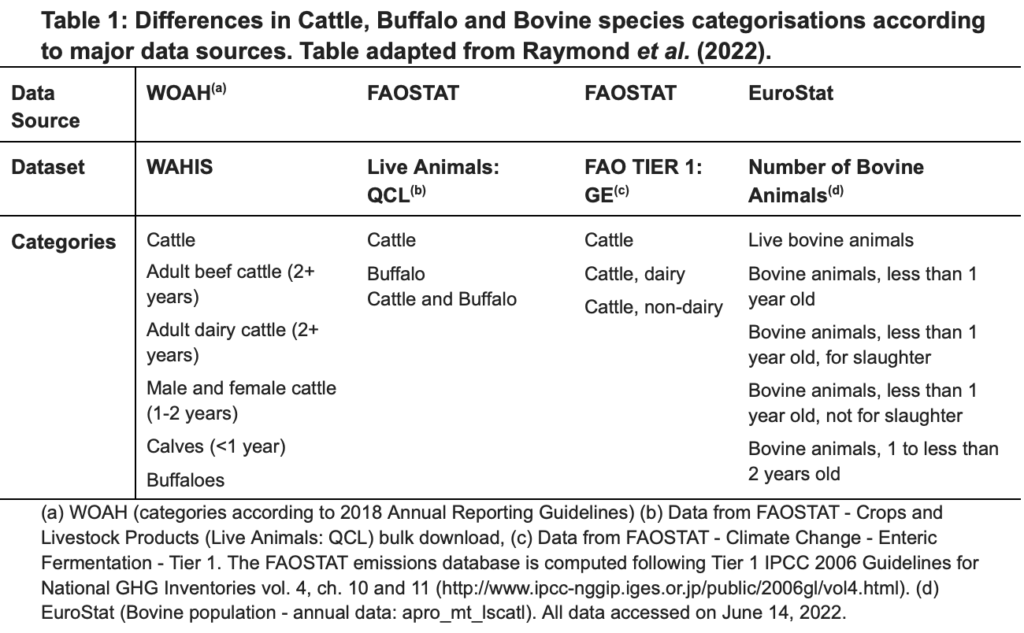
Table 1 shows an example of how different data sources use different terms to describe similar species. The table displays how bovine and cattle population data are described across four datasets that are commonly used in research and policy-making. While all sources report population data, they use different standards and naming conventions for cattle leading to difficulties in discovering data within a sector and interoperating between different data sources.
The Livestock Agriculture Graph
Due to the decentralization of both the sources of data and the categorizations, there is a need to centralize the data while also allowing users to understand the connections within the datasets themselves.
Figure 1 provides an overview of the graph model being used by GBADs. Databases from organizations are separated based on data tables (for instance, a population data table) and further disaggregated by country, and then columns within these tables. Since different countries may report different categories within a single data source, the graph connects countries to species that are reported. The result is a network of data sources, tables, countries, and species within the livestock sector, allowing users to understand how data categories are connected and reported by different countries. In addition, when data for a given country and category is not available, traversing the graph provides a means to understand when such data may be reported elsewhere.
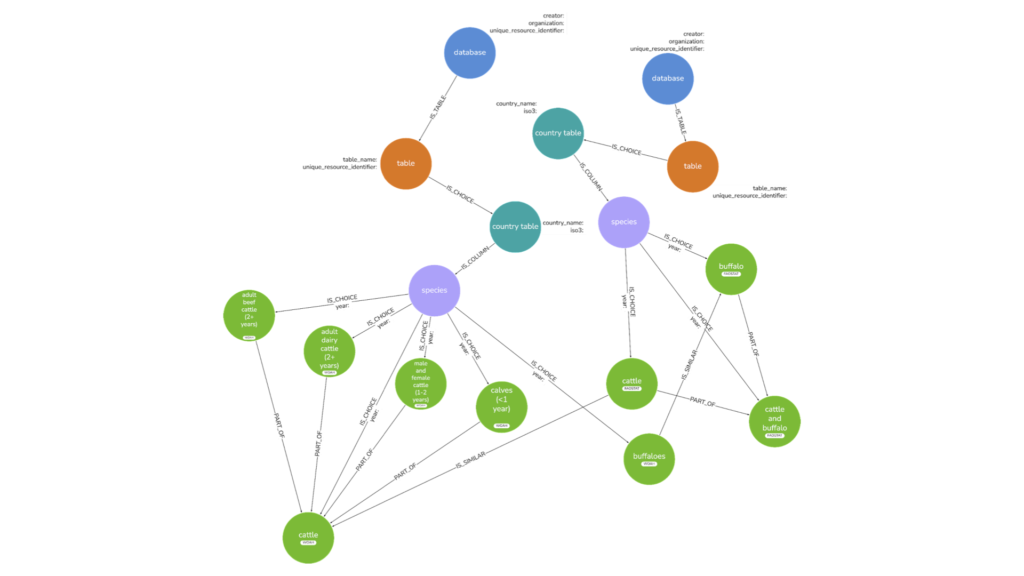
From the graph, we can identify concepts that were otherwise not available such as similar categories in datasets using the IS_SIMILAR relationship. For instance, calves (<1 year) by WOAH and Bovine animals, less than 1 year old by EuroStat (Table 1) are different categories but the definitions are the same. Using the graph we can identify, link, and extract this relationship to determine whether there is also numerical agreeability in these categories.
Implications in the Broader Datasphere
Analyzing the interoperability of standard naming conventions in the Datasphere is more than just linking data within sectors; we must consider how data is described and categorized between sectors and organizations to have a true understanding of the intrinsic interconnectedness of the data.
Aside from improving the discoverability and interoperability of data, drawing together datasets that are normally independently distributed across the Datasphere challenges us to reframe our thinking about data.
By analyzing the interconnectedness (or lack thereof) of data across the Datasphere, we invite opportunities to explore the nuances of data categorization in relation to power dynamics in the creation of standards (e.g. naming options).
Raymond K, N. BenSassi, G.T. Patterson, B. Huntington, J. Rushton, D.A. Stacey, T.M. Bernardo, “The Global Burden of Animal Diseases and One Health Data”, Unpublished Manuscript.